Monitoring OpenStack instances with Grafana, Graphite and Collectd

Environment:
^ OpenStack Victoria with Kolla Ansible Deployment
^ OS Ubuntu 18.04
^ 2 NIC
^ 4 Host :
- Controller (8Gb RAM, 4 vCPU, 70Gb Disk)=> 192.168.1.12
- Compute1 (8Gb RAM, 4 vCPU, 70Gb Disk)=> 192.168.1.13
- Compute2 (8Gb RAM, 4 vCPU, 70Gb Disk)=> 192.168.1.14
- Storage1 (2Gb RAM, 4 vCPU, 50Gb Disk1, 80 Disk2)=> 192.168.1.15
We will install graphite and grafana only on Compute1 then install collected on both Compute1 and Compute2 because these 2 nodes manage the instances. For grafana dashboard we used this reference Monitoring VMs on OpenStack (or KVM) using Graphite + Collectd by Huyen Trang.
Okay lets do it!
1. Install collectd on Compute1 and Compute2
In my environment I have ubuntu, so I use this command:
sudo apt-get update
sudo apt-get install collectd
For CentOS, Fedora, Red Hat use :
yum install epel-release -y
yum install collectd -y
yum install collectd-virt.x86_64 -y
2. Install graphite on Compute1
We will install Graphite on Ubuntu 18.04 using Docker so check your Docker service first.
systemctl status dockerOnce the docker engine is installed and running, it is time to start docker container for Graphite and Statsd. We will use the official Docker repo for Graphite. Create directories on the host system for persistent data storage:
sudo mkdir -p /data/graphite/{statsd,configs,data}Graphite & Statsd can be complex to set up. The docker image provided will have you running & collecting stats in just a few minutes. Execute this command:
sudo docker run -d \
 --name graphite \
 --restart=always \
 -p 80:80 \
 -p 2003-2004:2003-2004 \
 -p 2023-2024:2023-2024 \
 -p 8125:8125/udp \
 -p 8126:8126 \
 -v /data/graphite/configs:/opt/graphite/conf \
 -v /data/graphite/data:/opt/graphite/storage \
 -v /data/graphite/statsd:/opt/statsd \
 graphiteapp/graphite-statsd
Wait for docker engine to download and start docker container for you. Once it is done, see docker container running use: This starts a Docker container named: graphite.
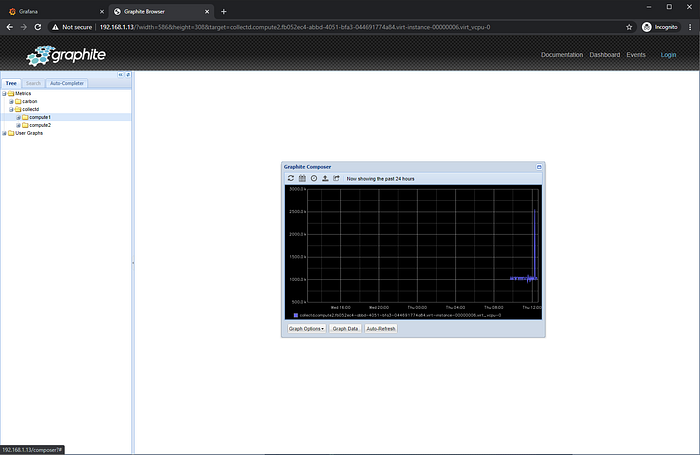
sudo docker ps | grep graphiteAccessing the Graphite Web interface:

3. Install Grafana on Controller
To install the latest Grafana OSS release on Ubuntu 18.04:
sudo apt-get install -y apt-transport-https
sudo apt-get install -y software-properties-common wget
wget -q -O - https://packages.grafana.com/gpg.key | sudo apt-key add -
Add this repository for stable releases:
echo "deb https://packages.grafana.com/oss/deb stable main" | sudo tee -a /etc/apt/sources.list.d/grafana.listAfter you add the repository:
sudo apt-get update
sudo apt-get install grafana
*For CentOS, Fedora, Red Hat use this command:
sudo tee /etc/yum.repos.d/grafana.repo<<EOF
[grafana]
name=grafana
baseurl=https://packages.grafana.com/oss/rpm
repo_gpgcheck=1
enabled=1
gpgcheck=1
gpgkey=https://packages.grafana.com/gpg.key
sslverify=1
sslcacert=/etc/pki/tls/certs/ca-bundle.crt
EOF
Install Grafana with one of the following commands:
sudo yum install grafanaStart the service and verify that the service has started:
sudo systemctl daemon-reload
sudo systemctl enable --now grafana-server
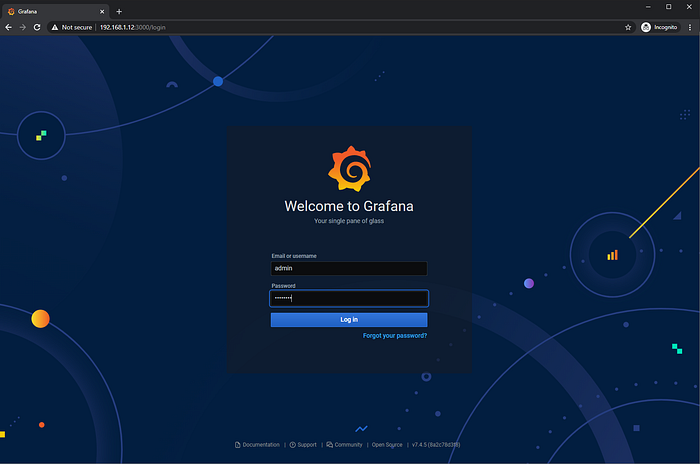
sudo systemctl status grafana-serverAccess Grafana dashboard http://IP_Controller:3000/
Log in first to Grafana dashboard
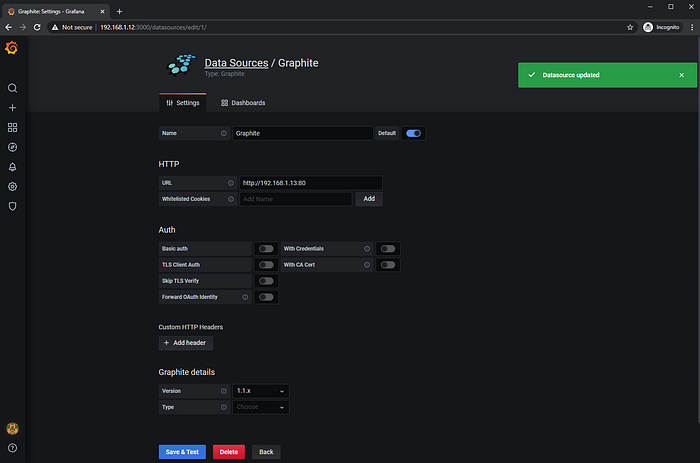
Add Data Source and choose Graphite

Fill URL with IP address Compute1 ( http://192.168.1.13:80 )
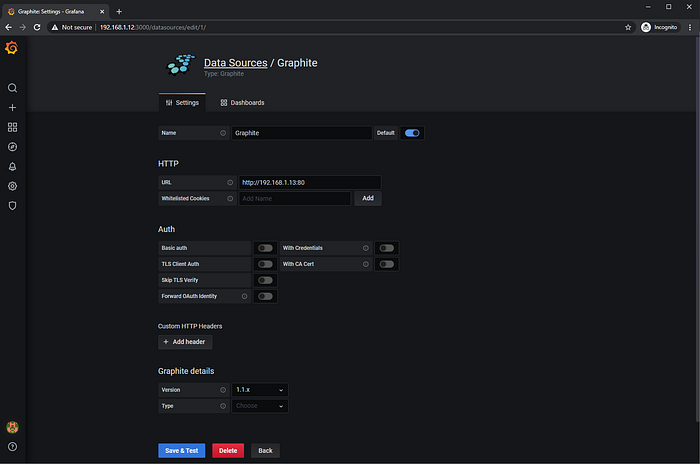
Click Save and Test
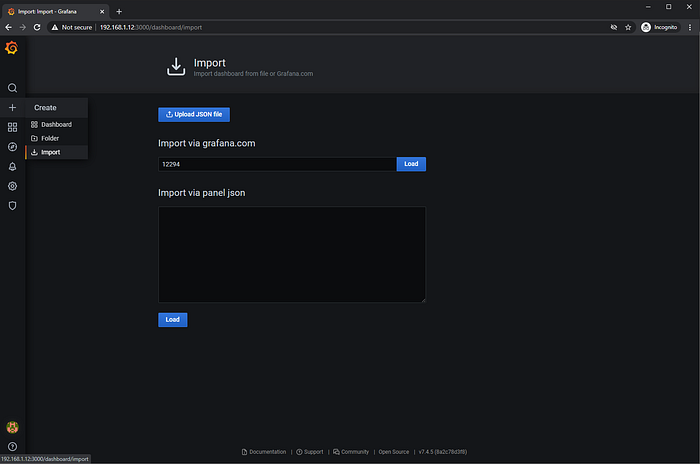
Then Import dashboard template, Click “+” sign → Import → enter the ID of a template (12294)
We already installing collectd, graphite and grafana. Next we configure collectd on Compute1 and Compute2. The configuration file is in /etc/collectd/collectd.conf.
On Compute1:
Hostname    "compute1"  #disesuaikan
FQDNLookup   falseLoadPlugin write_graphite
LoadPlugin unixsock
LoadPlugin virt
Interval 120<Plugin unixsock>
    SocketFile "/var/run/collectd-unixsock"
    SocketGroup "collectd"
    SocketPerms "0770"
    DeleteSocket false
</Plugin><Plugin "virt">
   RefreshInterval 10
   Connection "qemu:///system"
   BlockDeviceFormat "target"
   HostnameFormat "uuid"
   InterfaceFormat "address"
   PluginInstanceFormat name
   ExtraStats "cpu_util disk_err domain_state job_stats_background perf vcpupin"
</Plugin><Plugin write_graphite>
  <Node "graphite">
    Host "192.168.1.13"  #IP Address graphite
    Port "2003"
    Protocol "tcp"
    LogSendErrors true
    Prefix "collectd.compute1."  #disesuaikan
#   Postfix "collectd"
    StoreRates true
    AlwaysAppendDS false
    EscapeCharacter "_"
  </Node>
</Plugin>
on Compute2:
Hostname    "compute2"  #disesuaikan
FQDNLookup   falseLoadPlugin write_graphite
LoadPlugin unixsock
LoadPlugin virt
Interval 120<Plugin unixsock>
    SocketFile "/var/run/collectd-unixsock"
    SocketGroup "collectd"
    SocketPerms "0770"
    DeleteSocket false
</Plugin><Plugin "virt">
   RefreshInterval 10
   Connection "qemu:///system"
   BlockDeviceFormat "target"
   HostnameFormat "uuid"
   InterfaceFormat "address"
   PluginInstanceFormat name
   ExtraStats "cpu_util disk_err domain_state job_stats_background perf vcpupin"
</Plugin><Plugin write_graphite>
  <Node "graphite">
    Host "192.168.1.13"  #IP Address graphite
    Port "2003"
    Protocol "tcp"
    LogSendErrors true
    Prefix "collectd.compute2."  #disesuaikan
#   Postfix "collectd"
    StoreRates true
    AlwaysAppendDS false
    EscapeCharacter "_"
  </Node>
</Plugin>
*For Centos, RHEL, Fedora file configuration on /etc/collectd.conf
Restart service, do on both compute1 and compute2
systemctl restart collectd
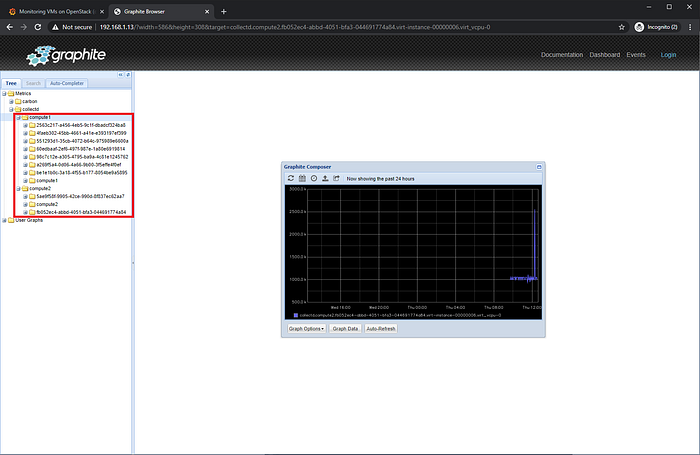
^restart^statusCheck on graphite:
For a few minutes, we will see metrics data on inside collectd folder
Then check on grafana, you will see metrics on Compute1 and Compute2:
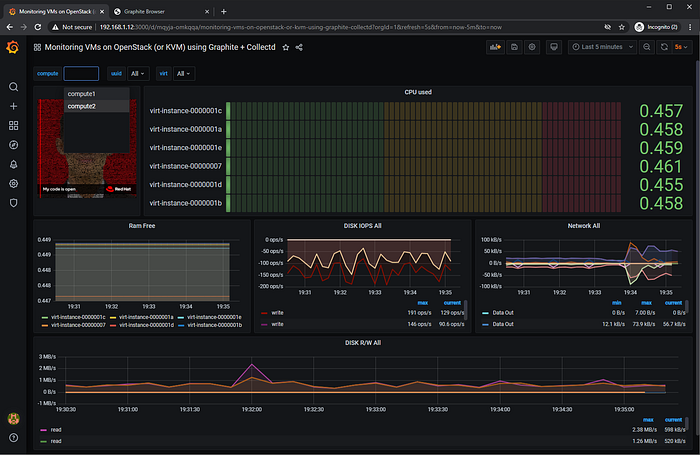
The instances metrics can be monitor now, there are CPU, RAM, Disk IOPS, Disk R/W and Network.
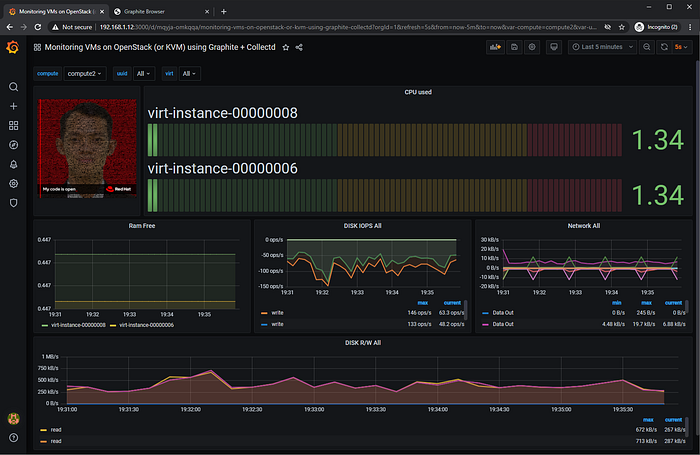
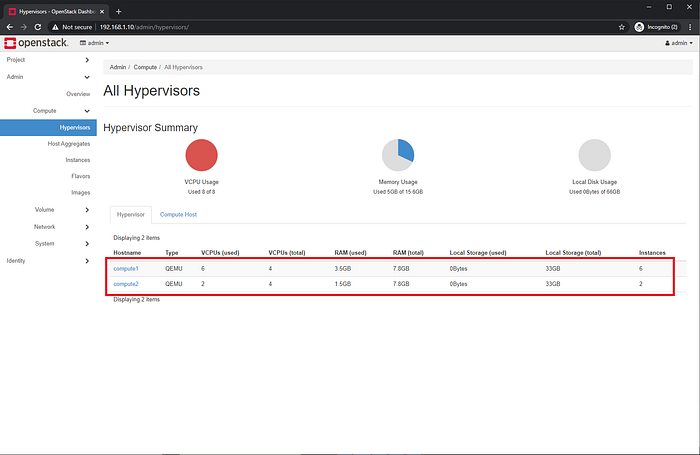
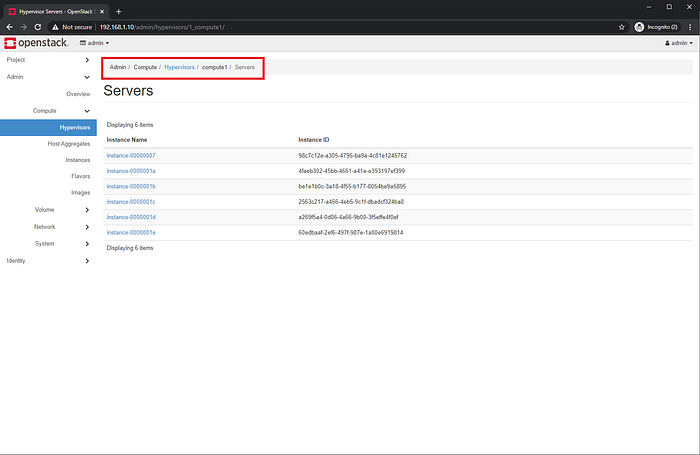
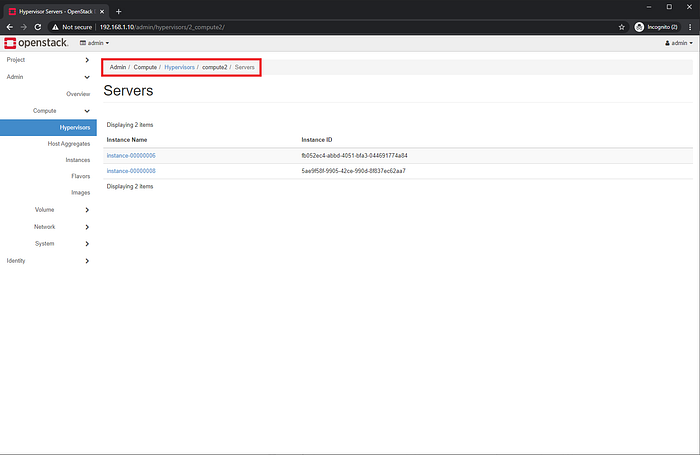
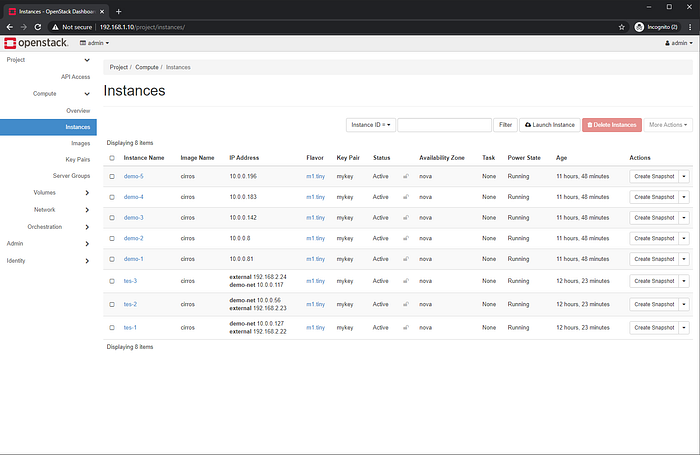
Verify workload or instances with OpenStack Dashboard, we will see the number of instances on Compute1 and Compute2
References :
- https://computingforgeeks.com/how-to-install-and-configure-graphite-on-ubuntu-18-04/
- https://grafana.com/docs/grafana/latest/installation/debian/
- https://grafana.com/grafana/dashboards/12294
#OpenStack #MonitoringTools #StayHealth